

By The Roofing Brief Team. Last reviewed: November 2026.
Rapid City, South Dakota logged 964 reports of hail 1 inch or larger between 2016 and 2025, or 617 for every 100,000 residents, the highest rate of any US metro. San Francisco, Seattle and 21 other metros logged none. Those are two of the findings from The Roofing Brief’s mapping of every NOAA hail report for the last ten years onto the 350 metro areas where we rank roofers: 36,482 hail reports in all, 28,508 of them at 1 inch or larger, the size at which 3-tab asphalt shingles start to fail. The full table is below and the dataset is free to download.
Download the data: roofing-brief-hail-by-metro-2016-2025.csv (350 metros, 15 columns, 36 KB). Cite as: The Roofing Brief, “Damaging hail by US metro, 2016 to 2025,” from NOAA Storm Events data, November 2026.
The headline numbers
- 28,508 NOAA reports of hail 1 inch or larger fell inside the 350 metros, 2016 to 2025. Ten metros account for 28 percent of them.
- Dallas-Fort Worth leads on raw count with 1,657 reports, 283 of them for stones 2 inches or larger, and the largest NOAA property-damage total of any metro, about $6.1 billion in event entries.
- Rapid City, SD leads per resident at 617 reports per 100,000 people. Twelve metros, all in the Plains and Front Range, pass 100 per 100,000. The median metro sits at 8.7.
- Texas metros logged 5,583 damaging-hail reports, more than Colorado (2,194) and Missouri (1,855) combined.
- San Antonio recorded the largest stone in the set, 6.42 inches, followed by Dallas-Fort Worth at 5.9 inches and Killeen-Temple at 5.68.
- Twenty-three metros had zero reports of 1 inch or larger in ten years: every Pacific coast metro from Santa Barbara to Bellingham, plus Anchorage, Kahului and The Villages, FL.
- May alone produced 25 percent of all hail reports; April, May and June together produced about 60 percent.
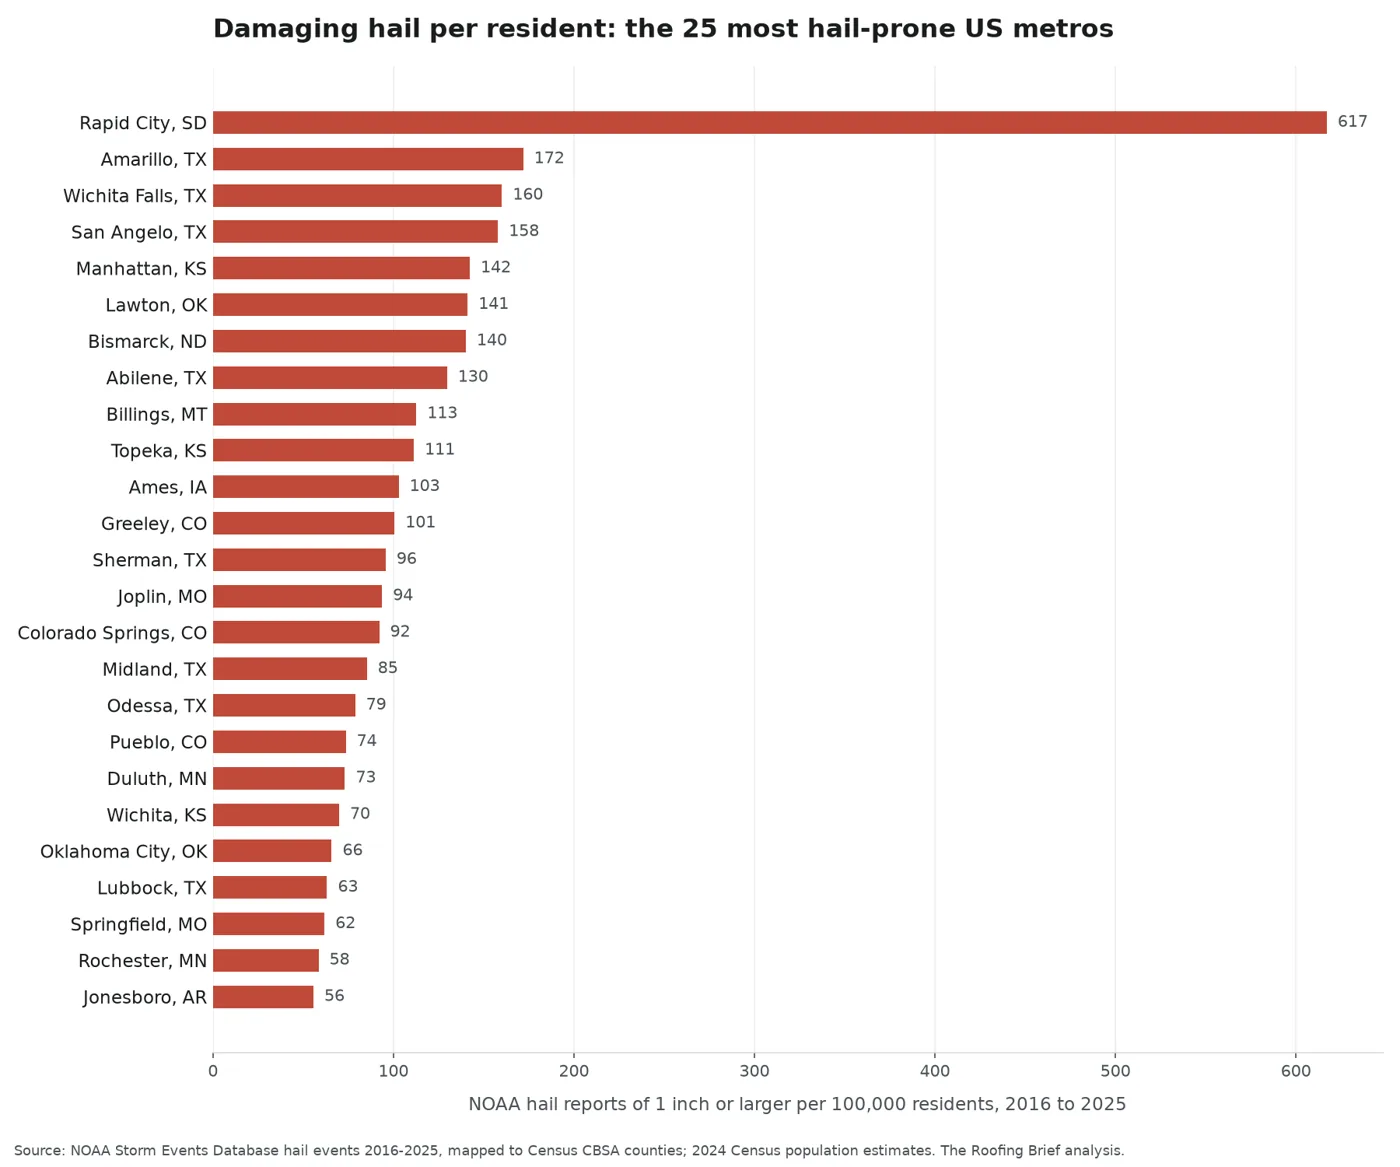
The 25 most hail-prone metros per resident
Per-resident rates answer the question a homeowner actually asks: how often does damaging hail hit where I live, regardless of how big the metro is. The rate favors metros whose counties cover a lot of ground with few people in them, which is why the Plains dominate. Rapid City’s three counties, Custer, Meade and Pennington, cover roughly 7,800 square miles for 156,000 residents.
| Rank | Metro | Reports, 1 in or larger | Per 100,000 residents | Reports, 2 in or larger | Largest stone |
|---|---|---|---|---|---|
| 1 | Rapid City, SD | 964 | 617.1 | 145 | 4.50 in |
| 2 | Amarillo, TX | 472 | 171.9 | 70 | 4.25 in |
| 3 | Wichita Falls, TX | 240 | 160.1 | 26 | 5.33 in |
| 4 | San Angelo, TX | 192 | 157.9 | 47 | 4.00 in |
| 5 | Manhattan, KS | 192 | 142.3 | 32 | 3.50 in |
| 6 | Lawton, OK | 179 | 141.1 | 30 | 4.00 in |
| 7 | Bismarck, ND | 195 | 140.1 | 40 | 4.50 in |
| 8 | Abilene, TX | 239 | 129.7 | 37 | 4.00 in |
| 9 | Billings, MT | 217 | 112.7 | 26 | 3.00 in |
| 10 | Topeka, KS | 259 | 111.3 | 26 | 4.50 in |
| 11 | Ames, IA | 133 | 102.9 | 11 | 2.75 in |
| 12 | Greeley, CO | 372 | 100.6 | 54 | 4.25 in |
| 13 | Sherman-Denison, TX | 144 | 95.7 | 11 | 2.50 in |
| 14 | Joplin, MO-KS | 194 | 93.7 | 17 | 3.00 in |
| 15 | Colorado Springs, CO | 716 | 92.1 | 69 | 4.00 in |
| 16 | Midland, TX | 161 | 85.3 | 39 | 4.00 in |
| 17 | Odessa, TX | 134 | 78.8 | 28 | 5.00 in |
| 18 | Pueblo, CO | 125 | 73.6 | 10 | 3.00 in |
| 19 | Duluth, MN-WI | 206 | 73.1 | 22 | 3.00 in |
| 20 | Wichita, KS | 462 | 69.9 | 40 | 3.00 in |
| 21 | Oklahoma City, OK | 986 | 65.8 | 141 | 4.25 in |
| 22 | Lubbock, TX | 232 | 63.2 | 50 | 5.00 in |
| 23 | Springfield, MO | 307 | 61.8 | 28 | 4.00 in |
| 24 | Rochester, MN | 135 | 58.5 | 11 | 2.75 in |
| 25 | Jonesboro, AR | 77 | 55.7 | 7 | 4.00 in |
Every figure in this table comes from the downloadable dataset; linked metros open our contractor ranking for that metro, and the rest are in the metro roofer index.
The 10 metros with the most damaging-hail reports
Raw counts tell the insurer’s story rather than the homeowner’s: where the most roofs get hit, not how likely any one roof is. Dallas-Fort Worth is first by a wide margin on every count measure, and it is 92nd per resident.
| Metro | Reports, 1 in or larger | Reports, 2 in or larger | Per 100,000 residents | NOAA property damage in event entries |
|---|---|---|---|---|
| Dallas-Fort Worth-Arlington, TX | 1,657 | 283 | 19.9 | $6.11 billion |
| Oklahoma City, OK | 986 | 141 | 65.8 | $132 million |
| Rapid City, SD | 964 | 145 | 617.1 | $0.2 million |
| Denver-Aurora-Centennial, CO | 759 | 76 | 24.9 | $2.58 billion |
| Colorado Springs, CO | 716 | 69 | 92.1 | $342 million |
| Kansas City, MO-KS | 683 | 63 | 30.3 | $28 million |
| Minneapolis-St. Paul-Bloomington, MN-WI | 682 | 81 | 18.1 | $31 million |
| St. Louis, MO-IL | 546 | 58 | 19.4 | $1.65 billion |
| San Antonio-New Braunfels, TX | 509 | 94 | 18.4 | $1.37 billion |
| Chicago-Naperville-Elgin, IL-IN | 502 | 34 | 5.3 | $1 million |
The damage column is the sum of the property-damage figures NOAA staff enter against each hail event, with the duplicated entries that appear in some large-storm episodes removed. It is an indicative number, not an insurance loss total; for insurer figures see our hail and storm loss database. Rapid City’s near-zero damage figure against 964 reports shows the limit: most of its hail falls on rangeland, not roofs.
The 15 biggest metros, where most readers live
For the largest metros the answer is mostly reassuring. Of the 15 most populous, only Dallas-Fort Worth (19.9 per 100,000) and Chicago (5.3) sit above the national median of 8.7, and two of them, San Francisco and Seattle, have not recorded a single 1-inch stone in ten years.
| Metro | Reports, 1 in or larger | Per 100,000 residents | Rank per resident (of 350) |
|---|---|---|---|
| New York-Newark-Jersey City, NY-NJ | 167 | 0.8 | 304 |
| Los Angeles-Long Beach-Anaheim, CA | 5 | 0.0 | 326 |
| Chicago-Naperville-Elgin, IL-IN | 502 | 5.3 | 228 |
| Dallas-Fort Worth-Arlington, TX | 1,657 | 19.9 | 92 |
| Houston-Pasadena-The Woodlands, TX | 218 | 2.8 | 273 |
| Miami-Fort Lauderdale-West Palm Beach, FL | 76 | 1.2 | 301 |
| Washington-Arlington-Alexandria, DC-VA-MD-WV | 322 | 5.0 | 232 |
| Atlanta-Sandy Springs-Roswell, GA | 248 | 3.9 | 252 |
| Philadelphia-Camden-Wilmington, PA-NJ-DE-MD | 174 | 2.7 | 274 |
| Phoenix-Mesa-Chandler, AZ | 80 | 1.5 | 293 |
| Boston-Cambridge-Newton, MA-NH | 70 | 1.4 | 295 |
| Riverside-San Bernardino-Ontario, CA | 10 | 0.2 | 321 |
| San Francisco-Oakland-Fremont, CA | 0 | 0.0 | 333 |
| Detroit-Warren-Dearborn, MI | 74 | 1.7 | 290 |
| Seattle-Tacoma-Bellevue, WA | 0 | 0.0 | 334 |
When it falls
Across all 350 metros, May produced 9,141 hail reports of any size, a quarter of the ten-year total. April (6,502) and June (6,145) follow, and the three months together hold about 60 percent of all reports. July adds 4,111 and March 3,816. For a roof owner in the Plains that gives a practical calendar: get the roof photographed and any loose flashing fixed in March, and expect the claim season to run April through June. Our guide to telling old hail damage from new explains why the date of the storm, not the date you notice the marks, starts the insurance clock.
What the numbers mean for your roof
If your metro is above about 50 reports per 100,000 residents, hail is not a rare event for you, it is a maintenance cost. Three things follow from the data.
- Buy the Class 4 shingle. UL 2218 Class 4 shingles are tested with 2-inch steel balls, and every metro in the top 25 has recorded stones that size. The premium over a standard architectural shingle is usually recovered through insurer discounts in the hail states; our state-by-state discount table lists which insurers and states offer them, and this guide ranks the shingles by the IBHS scorecard rather than by marketing claims.
- Read your wind and hail deductible before the storm, not after. Percentage deductibles of 1 to 2 percent of the dwelling limit are now common in Texas, Oklahoma, Colorado and the Plains. On a $400,000 house a 2 percent deductible is $8,000, which wipes out most repair claims and many replacement claims on older roofs; our roof age and claim severity report shows how fast the payout falls with roof age.
- Expect storm chasers in May. Out-of-state crews follow exactly the pattern in these tables. Our storm-chaser red flags list and the metro rankings, which score manufacturer-certified local contractors on public records, are the two pages to open before signing anything on the doorstep.
If your metro is in the bottom third, hail is not the peril to plan around. Wind, water and sun are, and a standard architectural shingle with correct flashing is the right purchase.
Method and limits
- Source. NOAA National Centers for Environmental Information, Storm Events Database, detail files for 2016 through 2025 (files dated March to August 2026). Every event typed “Hail” was kept, with its reported magnitude in inches, county, date and the property-damage estimate NOAA staff enter.
- Mapping. Each event’s state and county FIPS code was matched to the counties of the 2024 Census core-based statistical area definitions. Connecticut’s planning regions were translated back to the legacy counties NOAA still uses. Only the 350 metros The Roofing Brief covers are included, so national totals here are metro totals, not US totals.
- Damaging hail. Reports at 1.00 inch or larger, which is both the National Weather Service severe threshold and the size at which Haag Engineering’s field studies found 3-tab asphalt shingles begin to show functional damage. Laminated shingles typically need 1.25 inches.
- Reports are not storms. One hailstorm crossing a metro can produce dozens of reports from spotters, trained observers and the public. Counts therefore measure how often and how widely damaging hail is observed, and metros with more people and more spotters generate more reports per storm.
- Per-resident rates. Population is the Census Bureau’s Vintage 2024 estimate for the CBSA. The rate favors metros with large, thinly populated counties, which is why the per-resident list is dominated by the Plains. Read the count table and the rate table together.
- Damage figures. NOAA’s property-damage field is an estimate entered by local Weather Service offices and is incomplete and inconsistent across offices. Some large-storm episodes carry the same damage figure on several event rows; those duplicates were removed before summing. Use the column to compare magnitude, not as an insurance loss total.
- Reproduce it. The dataset lists each metro’s CBSA code, population, counts at every threshold, largest stone and damage total, so any row can be rebuilt from NOAA’s public files.
Frequently asked questions
Which US city gets the most hail?
By number of damaging-hail reports, Dallas-Fort Worth, with 1,657 NOAA reports of hail 1 inch or larger from 2016 to 2025, followed by Oklahoma City (986) and Rapid City, SD (964). Per resident, Rapid City leads at 617 reports per 100,000 people, with Amarillo, Wichita Falls and San Angelo, TX next.
Which big cities almost never get damaging hail?
San Francisco and Seattle recorded no hail of 1 inch or larger in ten years, and Los Angeles recorded five reports. Every Pacific coast metro from Santa Barbara to Bellingham, plus Anchorage and Kahului, had zero.
What month has the most hail?
May, with 9,141 of the 36,482 hail reports logged across 350 US metros from 2016 to 2025, about 25 percent. April, May and June together account for roughly 60 percent of all reports.
Where does the data come from and can I use it?
From NOAA’s Storm Events Database, mapped by The Roofing Brief to 2024 Census metro definitions. The CSV linked at the top of this page is free to download and cite with attribution to The Roofing Brief and NOAA.